Good research separates a forgettable talk from one people talk about weeks later. Research is also where most people get stuck. Too much information, too many tabs, too many interesting tangents, and too little time.
This guide walks through a clear, repeatable process for researching a presentation. You will learn where to find credible data and how to quickly judge a source. You will also learn how to organize what you find and turn raw notes into clean slide content. A final section covers how AI can shortcut the slow parts without compromising accuracy.
Key Takeaways
- Strong presentations start with focused research questions, not random Googling or AI conversations, so define your goal before you open a single browser tab.
- Trusted sources beat trendy ones: Prioritize primary research, peer-reviewed studies, government data, and recognized industry reports over surface-level blog posts.
- A simple note system with tags, summaries, and source links saves hours when you start turning research into slide content.
- Avoid info overload by setting time limits, capturing only what supports your core message, and cutting everything else.
- An AI presentation maker like Presentations.AI can compress research into structured outlines and ready-made slides, helping you move from notes to narrative faster.
How To Research For Your Presentation
Before opening a single tab or AI conversation, get clear on what your presentation actually needs to prove. Research without a goal is just reading. Reading without direction is the fastest way to burn three hours and end up with nothing usable on a slide.
The fix is simple: write down the single question your presentation must answer for your audience. Everything else flows from there.
Turn your topic into a focused research question
A topic is broad. A research question is sharp. "Remote work" is a topic. "What workplace policies actually improve remote team performance in 2026?" is a research question. The second one tells you exactly what to search for, what to ignore, and what counts as a strong answer.
Try this quick format:
- Audience: Who is in the room, and what do they already know?
- Outcome: What do you want them to think, feel, or do afterward?
- Core question: What single question, answered well, would create that outcome?
Write all three in one or two sentences before you start researching.
Break the core question into supporting sub-questions
Once you have your core question, list three to five sub-questions that, if answered, would build a complete argument. These become the backbone of your presentation outline later.
If your core question is about remote team performance, your sub-questions might cover current trends and how high-performing teams differ. Additional sub-questions could address common failure points and what the data says about hybrid models. Each sub-question maps neatly to a section of your deck.
Pro Tip: If a sub-question cannot be answered with a stat, quote, example, or expert insight, it is probably not worth a slide. Cut it now and save hours later.
Set a research scope and a time limit
Open-ended research expands to fill whatever time you give it. Decide upfront how deep you need to go. A five-minute internal update needs maybe thirty minutes of research. A client pitch or conference talk might need a few focused hours, not a few focused days.
Pick a time box, write it down, and stop when the timer ends. You will be surprised how much sharper your thinking becomes when the clock is visible. With your question, sub-questions, and scope locked in, you are ready to find the actual data, which is exactly where the next step begins.
Know Where to Look: The Best Sources for Presentation Research
With your question locked in, the next step is knowing where actually to find answers. Most people default to a quick Google search and grab whatever ranks on page one. That habit is exactly why so many decks end up citing the same recycled blog posts and stale statistics.
Better research starts with better sources. Here is a tiered approach to where you should be looking.
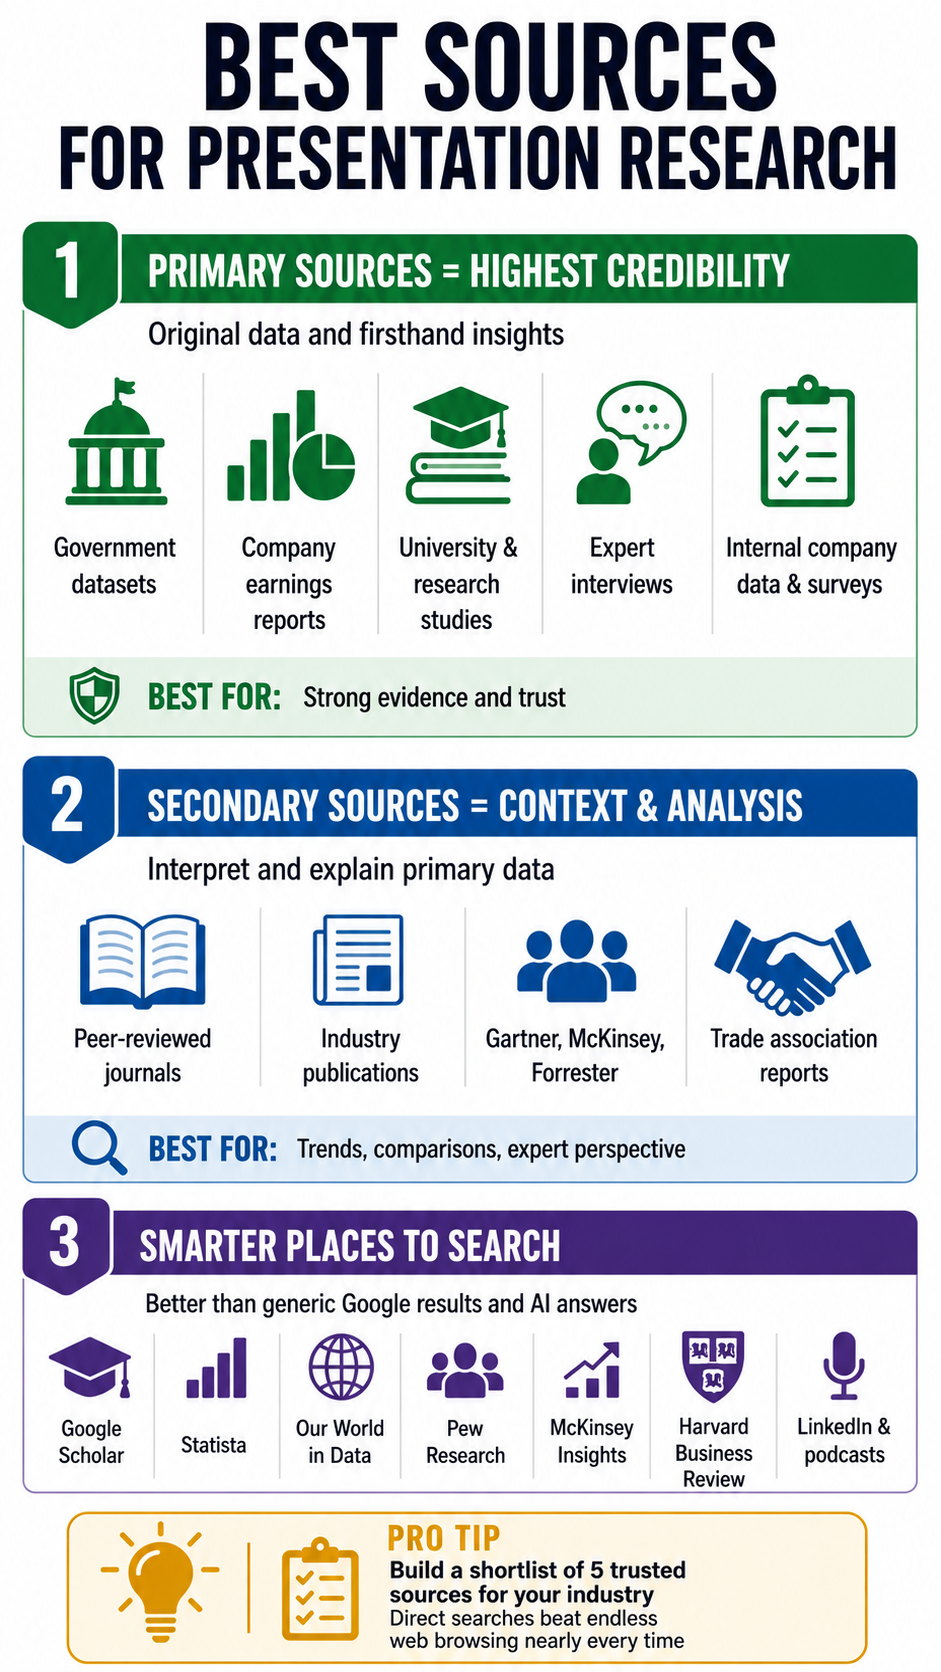
Primary sources: the gold standard
Primary sources are original data, original research, or firsthand accounts. They carry the most weight because nothing has been filtered, summarized, or spun before it reaches you.
Strong primary sources include:
- Original research reports from universities, think tanks, and research firms
- Government and public datasets like census data and labor statistics
- Company financials and earnings reports for business and market topics
- Interviews and direct quotes from subject matter experts in your field
- Internal data from your own organization, surveys, or customer research
If you can lead a slide with a primary source, do it. It instantly raises the credibility of everything around it.
Secondary sources: useful for context and synthesis
Secondary sources interpret, summarize, or analyze primary data. They are useful for context, comparisons, and finding patterns across multiple studies.
Reliable secondary sources include peer-reviewed journals and established industry publications that adhere to editorial standards. Recognized analyst firms like Gartner, McKinsey, and Forrester also fall here. Trade associations that publish annual benchmarks for their industries round out this tier.
Use these to frame your story and add expert perspective. Every secondary source eventually points back to a primary one, so chase the original whenever a stat looks important.
Where to actually search
A few starting points that consistently outperform a generic web search and AI answers:
- Google Scholar for academic and peer-reviewed work
- Statista and Our World in Data for cross-topic statistics
- Pew Research, McKinsey Insights, HBR for business and social trends
- Industry-specific databases relevant to your field
- LinkedIn and podcasts for current expert thinking and quotes
Pro Tip: Build a personal go-to list of sources for your industry. Five trusted sites you can search directly will outperform an hour of open-web browsing nearly every time.
How to Vet Sources and Avoid Information Overload
Finding sources is the easy part. Deciding which ones deserve a place in your deck is where most research breaks down. A system to stop the endless rabbit hole also matters, because a two-hour research block can quietly become a lost afternoon.
This section covers both: how to vet a source in under two minutes, and how to keep your research tight enough to actually finish.
The 60-second source check
Before you save any link or paste any quote, run it through a quick check. If it fails on more than one count, skip it.
- Who published it? Look at the organization behind the page, not just the writer. Is it a known institution, a recognized publisher, or a random content site?
- When was it published? For fast-moving topics like tech or workplace trends, anything older than two years is suspect.
- Where does the data come from? Strong sources cite their own sources. If a stat appears with no link or footnote, treat it as a rumor.
- What is the motive? A vendor's whitepaper about its own product category is useful but biased. Acknowledge the bias and balance it with neutral data.
- Does it agree with other sources? If only one site is reporting a number, seek confirmation before building a slide around it.
Triangulate your most important claims
For any stat or claim that will sit on a featured slide, find at least two independent sources that support it. This is called triangulation, and it is the single fastest way to avoid the embarrassment of citing a number that turns out to be wrong or outdated.
When two credible sources disagree, that disagreement is often more interesting than either number on its own. It can become a slide of its own.
Beat info overload with a strict capture rule
Information overload usually comes from saving everything just in case. The cure is a simple capture rule: only save material that directly answers one of your sub-questions.
Try this workflow:
- Open a single document or note for the presentation
- Create a section for each sub-question from Step 1
- Paste only quotes, stats, or insights that fit a section, with the source link directly underneath
- Anything that does not fit a section gets closed, not saved
Pro Tip: Give yourself a hard cap, like ten sources or ninety minutes, whichever comes first. Constraints force you to choose the best material rather than hoard the most material.
Watch for the common research traps
A few patterns quietly waste hours. Recognize them so you can shut them down quickly.
- AI copy/paste: AI doesn’t give you 100% correct information. It gives you inputs based on the data you trained on, or cites web results without understanding the credibility of the web page or blog. So ensure you cross-verify every single claim made by AI.
- The expanding scope: You start researching one question and end up three topics away. Reread your core question every twenty minutes.
- The shiny stat: A surprising number is fun, but if it does not support your argument, it does not belong in your deck.
- The perfection loop: Looking for the perfect source when a strong one already exists. Good enough, cited well, beats perfect, and never finished.
Organize Your Research
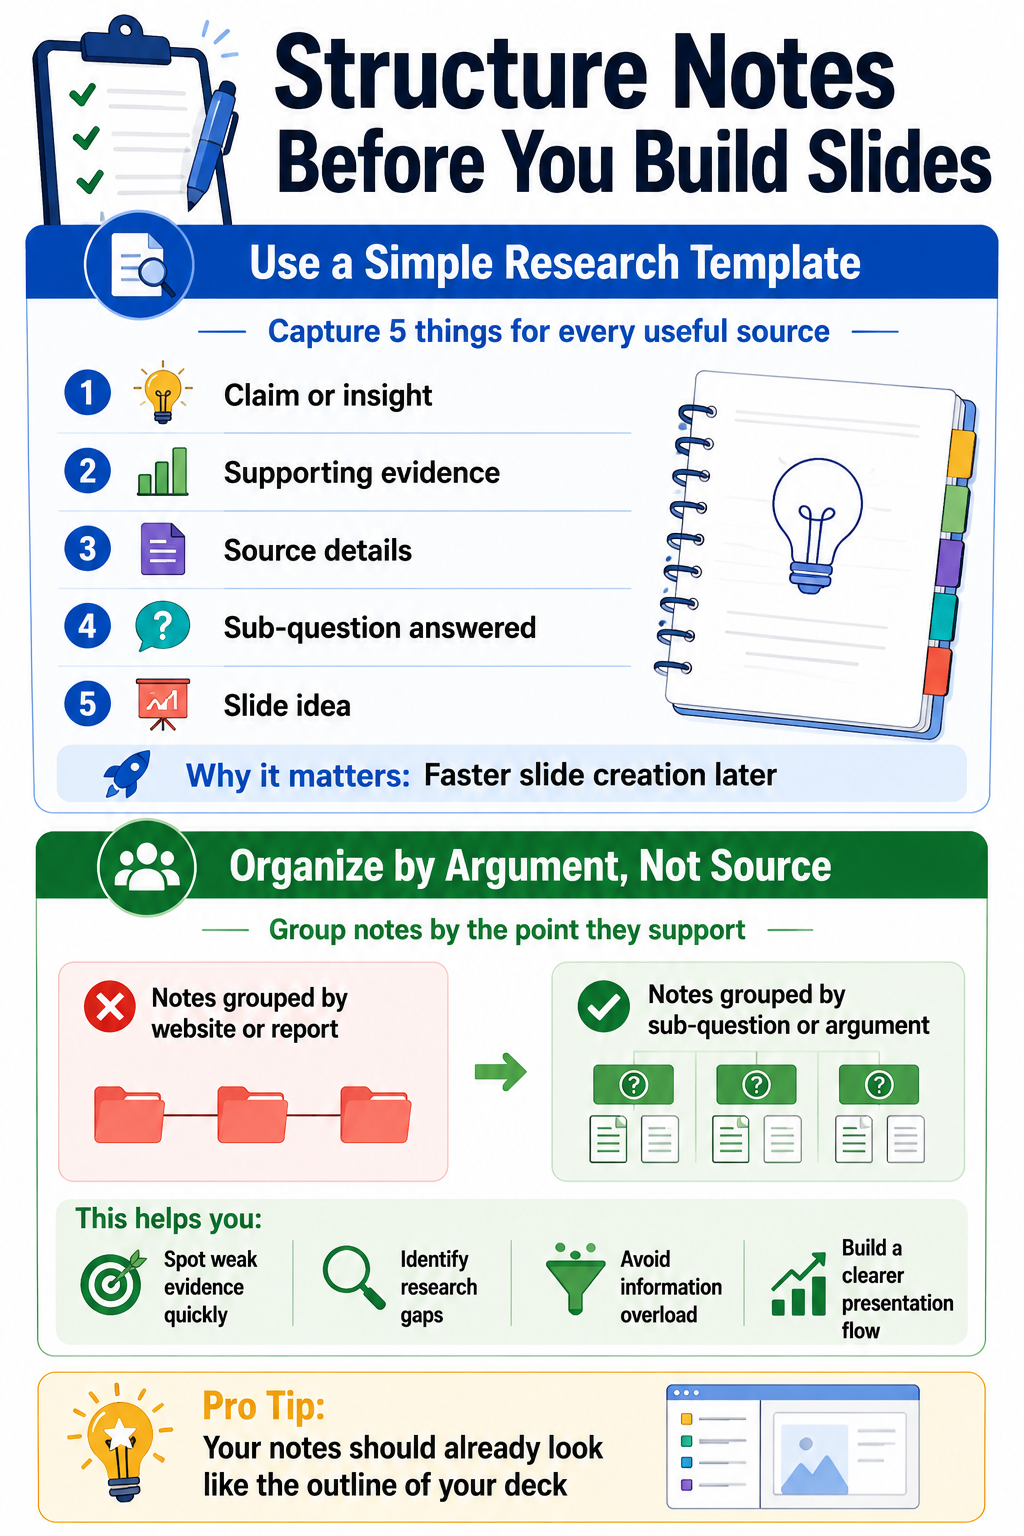
Treating note-taking as a dump-everything-into-one-doc exercise leads to panic when it is time to build slides. A small amount of structure during research saves enormous time later. Done right, your notes should already look like the skeleton of your deck.
Use a simple, repeatable note structure
For each piece of research worth keeping, capture five fields:
- Claim or insight: What does this source actually say, in one sentence?
- Evidence: The specific stat, quote, or example that backs the claim
- Source: Publisher, author, date, and link
- Sub-question it answers: Which part of your argument does it support
- Slide idea: A quick note on how you might use it visually
This takes about 30 seconds per entry and pays for itself 10 times over when you start designing.
Group notes by argument, not by source
A common mistake is organizing notes by where you found them. That mirrors the research process, not the presentation. Group everything by the sub-question or argument it supports instead.
When you finish, you should see clusters forming. One sub-question might have six strong pieces of evidence. Another might have only one weak quote. That imbalance is a gift: it tells you exactly where to dig deeper and where you already have more than enough.
Turn Your Research Into Clear, Compelling Slide Content
Organized notes are not slides. The translation step is where many well-researched presentations fall flat, because dense findings get copy-pasted onto crowded slides nobody can read. Each slide should carry one idea, backed by your strongest piece of evidence.
Lead with the insight, not the data
A slide that opens with a raw stat forces the audience to figure out the point. A slide that opens with the insight makes the point and uses the stat as evidence. That small reorder instantly makes your deck feel sharper. A few solid presentation tips on visual hierarchy go a long way here.
Try this slide formula for any research-driven slide:
- Headline: The insight, written as a full sentence
- Evidence: The single best stat, quote, or example that supports it
- Source: A small citation in the corner, so credibility is visible
- Visual: A chart, icon, or image that reinforces the headline
If a slide cannot fit into that structure, it is usually trying to say two things at once. Split it.
One idea per slide, one slide per sub-question cluster
Go back to the clusters you built in the previous step. Each sub-question should map to a small group of slides, not a single overstuffed one. A typical cluster might include:
- A setup slide that frames the sub-question
- One or two evidence slides with your strongest data
- A so-what slide that connects the evidence back to your core message
This rhythm keeps the deck moving and makes your argument easier to follow.
Cut anything that does not earn its place
Once your draft slides are built, do a ruthless pass. For every slide, ask whether removing it would weaken the argument. If the answer is no, remove it.
Common cuts include:
- Background slides that the audience already understands
- Stats that are interesting but off-topic
- Quotes that repeat a point you already made
- Bonus data that dilutes your strongest evidence
Pro Tip: A tight twelve-slide deck built on vetted research will always outperform a thirty-slide deck padded with filler. Trust your research enough to let it stand on its own.
Write speaker notes while the research is fresh
Right after you place a piece of evidence on a slide, write a sentence or two in the speaker notes about context, caveats, and where the data came from. You will thank yourself during rehearsal. You will also avoid the where-did-this-number-come-from question in Q&A. Keeping those notes sharp builds stronger presentation skills over time.
Use an AI Presentation Maker to Compress Research Into Ready-Made Slides
Even with a clean process, the gap between organized notes and a finished deck can still eat hours. An AI presentation maker addresses this directly. Used well, it removes the slow, manual work of turning your thinking into structured slides without replacing the research judgment behind them.
Where AI actually saves time in the research workflow
The biggest wins appear in the steps right after research, not in the research itself. A few places, an AI slide creator shortens the process:
- Summarizing long reports into the two or three points relevant to your sub-questions
- Drafting slide headlines from your raw insights so you are not staring at a blank slide
- Suggesting slide structures based on the argument you want to build
- Generating charts and visuals from data points you have already vetted
- Rewording dense paragraphs into clean, presentation-ready language
The pattern is consistent: you bring the judgment and the verified sources. AI handles the formatting, drafting, and layout work that usually takes the longest.
How Presentations.AI fits into the research-to-slides handoff
Once your notes are organized by sub-question, the AI presentation maker at Presentations.AI can turn that outline into a designed deck in minutes. Paste in your structured notes or a brief, and the tool drafts a full set of slides with headlines, layouts, and visuals already in place.
From there, your job shifts from building to editing. Swap in your vetted stats, adjust the wording to match your voice, and confirm every source citation is correct. The slow parts, such as designing layouts and balancing text with visuals, are already done.
Pro Tip: Treat AI-generated slides as a first draft, not a final deck. Your research and judgment are still what make the presentation credible. The tool just gets you to the editing stage much faster.
Keep a human review step on anything AI touches
AI can smooth over a nuance, misinterpret a stat, or oversimplify a claim. Before any AI-assisted slide goes into your final deck, do a quick check:
- Does the headline match what your source actually says?
- Are numbers, dates, and names correct?
- Is the citation still attached to the right claim?
- Does the tone match the rest of your deck and your audience?
This final pass takes a few minutes and protects everything your research has built.
Make Research the Foundation
Research is the quiet engine behind every presentation that actually lands. When you start with a sharp question, pull from credible sources, vet what you save, and organize notes by argument, the slide-building stage stops feeling like guesswork. You already have a structure, you already have evidence, and you already know which ideas earned their place on the deck.
The goal is to gather the right information, hold it to a standard, and translate it into a story your audience can follow and trust. Treat research as the first slide-building step, not a pre-step, and the entire process gets faster, calmer, and more credible from the moment you open your first tab.