Good research separates a forgettable talk from one people talk about weeks later. Research is also where most people get stuck. Too much information, too many tabs, too many interesting tangents, and too little time.
This guide walks through a clear, repeatable process for researching a presentation. You will learn where to find credible data and how to quickly judge a source. You will also learn how to organize what you find and turn raw notes into clean slide content. A final section covers how AI can shortcut the slow parts without compromising accuracy.
Key Takeaways
- Strong presentations start with focused research questions, not random Googling or AI conversations, so define your goal before you open a single browser tab.
- Trusted sources beat trendy ones: Prioritize primary research, peer-reviewed studies, government data, and recognized industry reports over surface-level blog posts.
- A simple note system with tags, summaries, and source links saves hours when you start turning research into slide content.
- Avoid info overload by setting time limits, capturing only what supports your core message, and cutting everything else.
- An AI presentation maker like Presentations.AI can compress research into structured outlines and ready-made slides, helping you move from notes to narrative faster.
How To Research For Your Presentation
Before opening a single tab or AI conversation, get clear on what your presentation actually needs to prove. Research without a goal is just reading. Reading without direction is the fastest way to burn three hours and end up with nothing usable on a slide.
The fix is simple: write down the single question your presentation must answer for your audience. Everything else flows from there.
Turn your topic into a focused research question
A topic is broad. A research question is sharp. "Remote work" is a topic. "What workplace policies actually improve remote team performance in 2026?" is a research question. The second one tells you exactly what to search for, what to ignore, and what counts as a strong answer.
Try this quick format:
- Audience: Who is in the room, and what do they already know?
- Outcome: What do you want them to think, feel, or do afterward?
- Core question: What single question, answered well, would create that outcome?
Write all three in one or two sentences before you start researching.
Break the core question into supporting sub-questions
Once you have your core question, list three to five sub-questions that, if answered, would build a complete argument. These become the backbone of your presentation outline later.
If your core question is about remote team performance, your sub-questions might cover current trends and how high-performing teams differ. Additional sub-questions could address common failure points and what the data says about hybrid models. Each sub-question maps neatly to a section of your deck.
Pro Tip: If a sub-question cannot be answered with a stat, quote, example, or expert insight, it is probably not worth a slide. Cut it now and save hours later.
Set a research scope and a time limit
Open-ended research expands to fill whatever time you give it. Decide upfront how deep you need to go. A five-minute internal update needs maybe thirty minutes of research. A client pitch or conference talk might need a few focused hours, not a few focused days.
Pick a time box, write it down, and stop when the timer ends. You will be surprised how much sharper your thinking becomes when the clock is visible. With your question, sub-questions, and scope locked in, you are ready to find the actual data, which is exactly where the next step begins.
Know Where to Look: The Best Sources for Presentation Research
With your question locked in, the next step is knowing where actually to find answers. Most people default to a quick Google search and grab whatever ranks on page one. That habit is exactly why so many decks end up citing the same recycled blog posts and stale statistics.
Better research starts with better sources. Here is a tiered approach to where you should be looking.
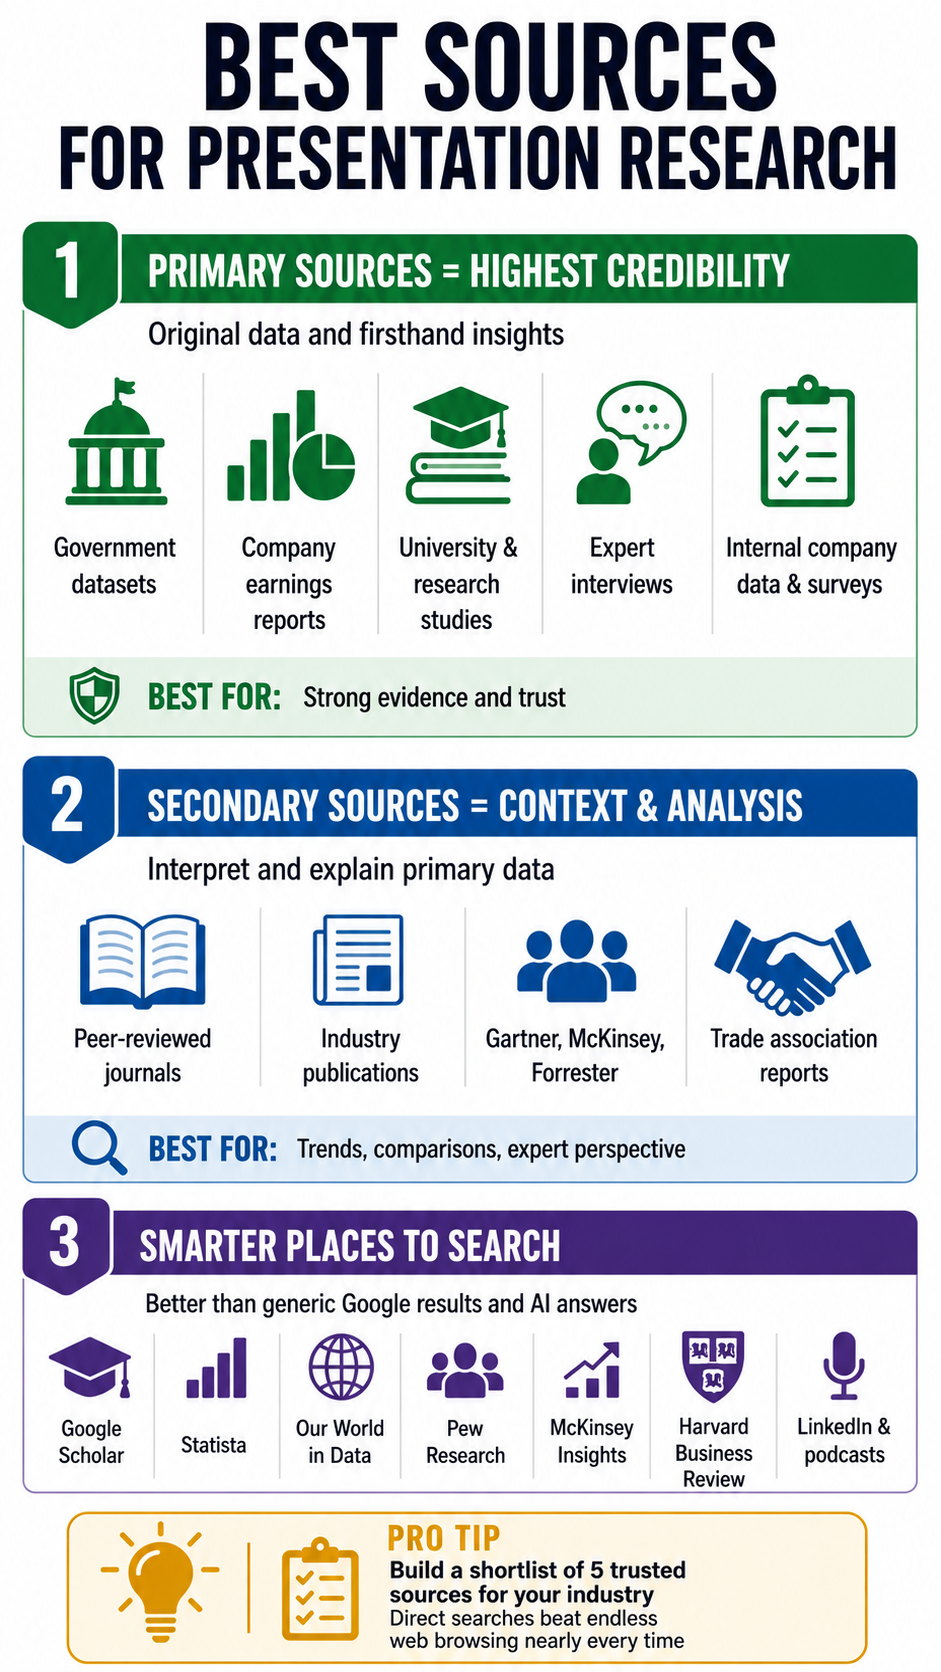
Primary sources: the gold standard
Primary sources are original data, original research, or firsthand accounts. They carry the most weight because nothing has been filtered, summarized, or spun before it reaches you.
Strong primary sources include:
- Original research reports from universities, think tanks, and research firms
- Government and public datasets like census data and labor statistics
- Company financials and earnings reports for business and market topics
- Interviews and direct quotes from subject matter experts in your field
- Internal data from your own organization, surveys, or customer research
If you can lead a slide with a primary source, do it. It instantly raises the credibility of everything around it.
Secondary sources: useful for context and synthesis
Secondary sources interpret, summarize, or analyze primary data. They are useful for context, comparisons, and finding patterns across multiple studies.
Reliable secondary sources include peer-reviewed journals and established industry publications that adhere to editorial standards. Recognized analyst firms like Gartner, McKinsey, and Forrester also fall here. Trade associations that publish annual benchmarks for their industries round out this tier.
Use these to frame your story and add expert perspective. Every secondary source eventually points back to a primary one, so chase the original whenever a stat looks important.
Where to actually search
A few starting points that consistently outperform a generic web search and AI answers:
- Google Scholar for academic and peer-reviewed work
- Statista and Our World in Data for cross-topic statistics
- Pew Research, McKinsey Insights, HBR for business and social trends
- Industry-specific databases relevant to your field
- LinkedIn and podcasts for current expert thinking and quotes
Pro Tip: Build a personal go-to list of sources for your industry. Five trusted sites you can search directly will outperform an hour of open-web browsing nearly every time.
How to Vet Sources and Avoid Information Overload
Finding sources is the easy part. Deciding which ones deserve a place in your deck is where most research breaks down. A system to stop the endless rabbit hole also matters, because a two-hour research block can quietly become a lost afternoon.
This section covers both: how to vet a source in under two minutes, and how to keep your research tight enough to actually finish.
The 60-second source check
Before you save any link or paste any quote, run it through a quick check. If it fails on more than one count, skip it.
- Who published it? Look at the organization behind the page, not just the writer. Is it a known institution, a recognized publisher, or a random content site?
- When was it published? For fast-moving topics like tech or workplace trends, anything older than two years is suspect.
- Where does the data come from? Strong sources cite their own sources. If a stat appears with no link or footnote, treat it as a rumor.
- What is the motive? A vendor's whitepaper about its own product category is useful but biased. Acknowledge the bias and balance it with neutral data.
- Does it agree with other sources? If only one site is reporting a number, seek confirmation before building a slide around it.
Triangulate your most important claims
For any stat or claim that will sit on a featured slide, find at least two independent sources that support it. This is called triangulation, and it is the single fastest way to avoid the embarrassment of citing a number that turns out to be wrong or outdated.
When two credible sources disagree, that disagreement is often more interesting than either number on its own. It can become a slide of its own.
Beat info overload with a strict capture rule
Information overload usually comes from saving everything just in case. The cure is a simple capture rule: only save material that directly answers one of your sub-questions.
Try this workflow:
- Open a single document or note for the presentation
- Create a section for each sub-question from Step 1
- Paste only quotes, stats, or insights that fit a section, with the source link directly underneath
- Anything that does not fit a section gets closed, not saved
Pro Tip: Give yourself a hard cap, like ten sources or ninety minutes, whichever comes first. Constraints force you to choose the best material rather than hoard the most material.
Watch for the common research traps
A few patterns quietly waste hours. Recognize them so you can shut them down quickly.
- AIによるコピペ: AIは100%正確な情報を提供するわけではありません。学習データに基づいた情報を提供するか、ウェブページやブログの信頼性を理解せずにウェブ上の結果を引用します。そのため、AIが提示するすべての主張を必ず相互検証してください。
- 範囲の拡大: 一つの疑問を調べ始めたのに、いつの間にか3つも別のトピックに逸れてしまうことがあります。20分ごとに、本来の問いを読み直しましょう。
- 目を引く統計: 驚くような数字は面白いものですが、それがあなたの主張を裏付けないなら、資料に含めるべきではありません。
- 完璧主義のループ: 既に十分な情報源があるのに、完璧な情報源を探し続けること。十分に良く、適切に引用されたものは、完璧で終わらないものよりも優れています。
リサーチを整理する
メモ取りを「すべてを一つのドキュメントに放り込む作業」と捉えると、スライド作成時にパニックに陥ります。リサーチ中に少し構造化するだけで、後で膨大な時間を節約できます。適切に行えば、メモはすでにスライド資料の骨格のように見えるはずです。
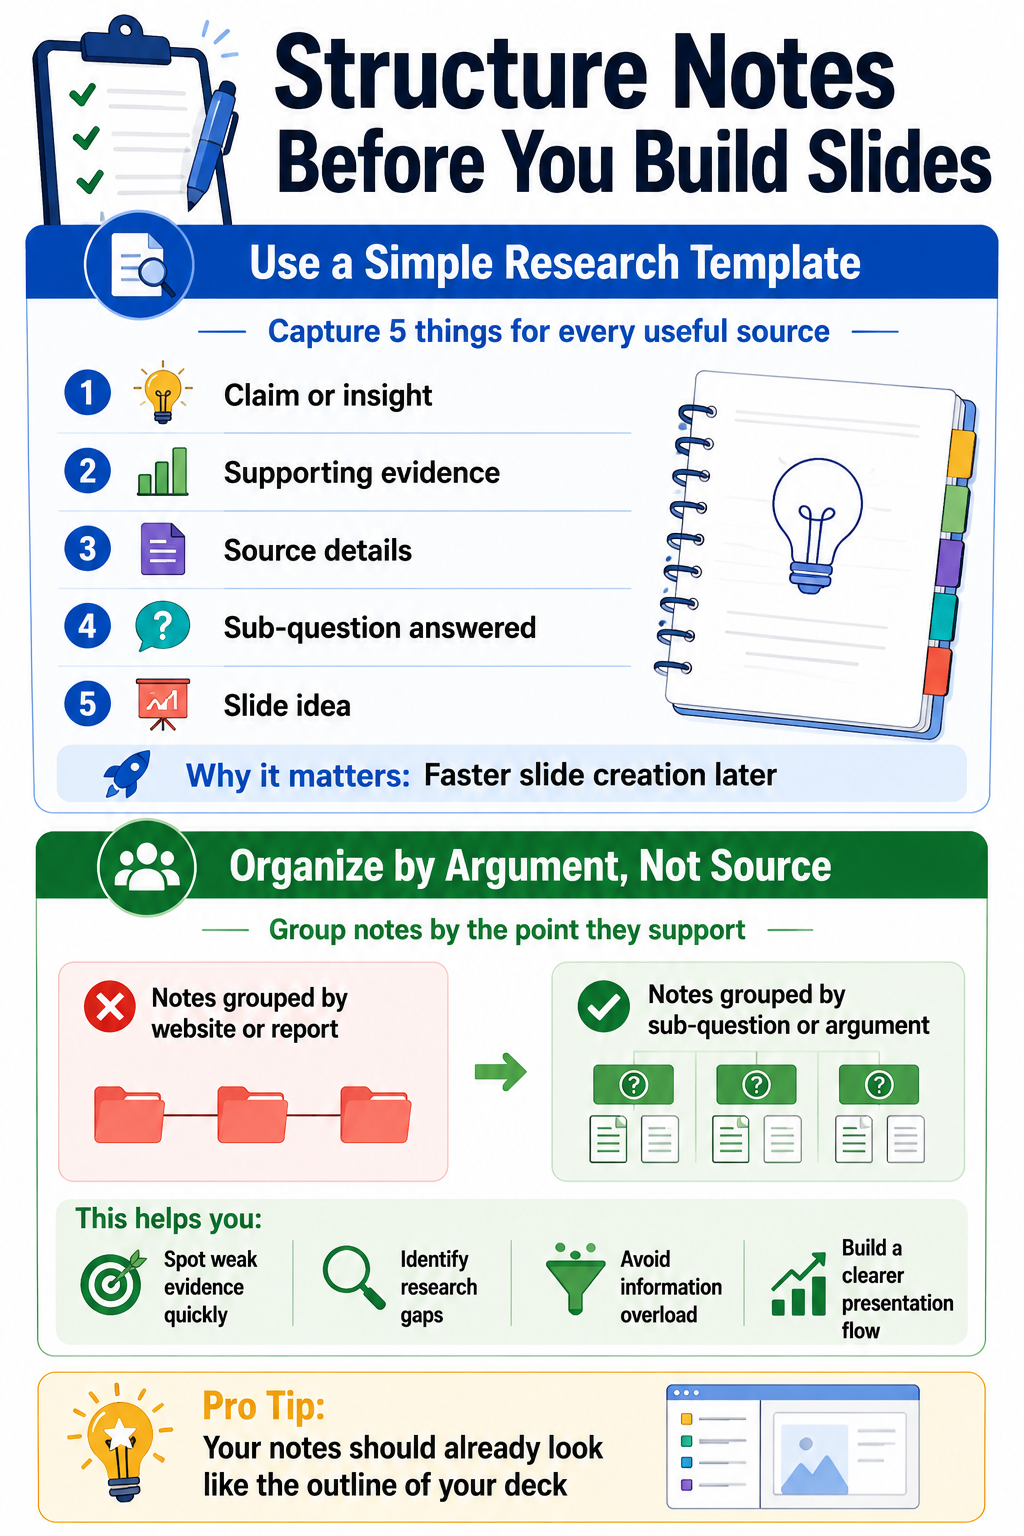
シンプルで再現性のあるメモの構造を使う
保存する価値のあるリサーチごとに、以下の5つの項目を記録しましょう:
- 主張または洞察: この情報源は、一文で何を述べていますか?
- 証拠: その主張を裏付ける具体的な統計、引用、または例
- 情報源: 出版元、著者、日付、リンク
- それが答える副次的な問い: あなたの議論のどの部分を裏付けていますか?
- スライドのアイデア: 視覚的な活用法について簡単なヒント
1項目あたり約30秒で済みますが、デザインに取り掛かる際には10倍の元が取れるはずです。
情報源ではなく、論点ごとにメモをグループ化する
よくある間違いは、メモを見つけた情報源ごとに整理することです。それは調査プロセスをなぞるものであり、プレゼンテーションとは異なります。そうではなく、それぞれのメモが裏付ける副次的な質問や論点ごとにすべてをまとめましょう。
作業が終わると、いくつかのまとまり(クラスター)ができているはずです。ある副次的な質問には6つの強力な証拠があるかもしれませんが、別の質問には弱い引用が1つしかないかもしれません。この不均衡こそが贈り物です。どこをさらに深く掘り下げるべきか、そしてどこはすでに十分すぎるほど情報があるのかを正確に教えてくれるからです。
調査結果を明確で魅力的なスライドコンテンツに変換する
整理されたメモはスライドではありません。多くの綿密に調査されたプレゼンテーションが台無しになるのは、この変換の段階です。情報がぎっしり詰まった調査結果が、誰も読めないようなごちゃごちゃしたスライドにコピー&ペーストされてしまうからです。各スライドは1つのアイデアを伝え、最も強力な証拠によって裏付けられるべきです。
データではなく、まず洞察を示す
生の統計データから始まるスライドは、聴衆にその要点を理解させようと強いることになります。洞察から始まるスライドは、要点を明確にし、統計データを証拠として使用します。この小さな順序の変更が、あなたのプレゼン資料を瞬時にシャープに見せます。いくつかの確かな プレゼンテーションのヒント 視覚的階層に関するものは、ここでは大いに役立ちます。
あらゆる調査に基づいたスライドに、この公式を試してみてください。
- 見出し: 完全な文章で書かれた洞察
- 証拠: それを裏付ける、最も優れた唯一の統計、引用、または例
- 出典: 信頼性がわかるように、隅に小さく出典を記載します。
- ビジュアル: 見出しを補強するグラフ、アイコン、または画像
もしスライドがその構成に収まらない場合、それは通常、一度に2つのことを伝えようとしています。分割してください。
1スライドにつき1つのアイデア、副次的な質問のまとまりごとに1スライド
前のステップで作成したまとまりに戻りましょう。各副次的な質問は、情報が詰め込まれすぎた1枚のスライドではなく、少数のスライド群に対応させるべきです。典型的なまとまりには、以下が含まれるでしょう。
- 副次的な質問の枠組みを示す導入スライド
- 最も強力なデータを含む1枚または2枚の根拠スライド
- その根拠を主要なメッセージに結びつける「だから何?」スライド
このリズムによって、プレゼンテーションの流れがスムーズになり、主張がより理解しやすくなります。
その場にふさわしくないものはすべて削除する
ドラフトスライドが完成したら、容赦なく見直しを行いましょう。各スライドについて、それを削除することで主張が弱まるかどうかを問いかけてください。答えが「いいえ」であれば、削除しましょう。
よく削除されるものには、以下が含まれます。
- 聴衆がすでに理解している背景説明のスライド
- 興味深いものの、本題から外れている統計
- すでに述べた点を繰り返す引用
- 最も強力な根拠を希薄にする補足データ
プロのヒント: 厳選された調査に基づいた引き締まった12枚のスライドのデッキは、余分な情報で水増しされた30枚のスライドのデッキよりも常に優れた結果を出します。あなたの調査を信頼し、それ自体で成り立つようにしましょう。
調査が新鮮なうちにスピーカーノートを作成する
スライドに根拠となる情報を配置したらすぐに、その背景、注意点、データの出所についてスピーカーノートに1、2文書き込みましょう。そうすれば、リハーサルの際に自分自身に感謝することになるでしょう。また、質疑応答で「この数字はどこから来たのですか?」という質問を避けることもできます。これらのメモを明確にしておくことで、より強力な プレゼンテーションスキル 時間とともに。
AIプレゼンテーション作成ツールを使ってリサーチを凝縮し、すぐに使えるスライドに
効率的なプロセスであっても、整理されたメモと完成した資料の間には、依然として何時間もの作業が必要になることがあります。AIプレゼンテーション作成ツールは、この課題に直接対処します。うまく活用すれば、思考を構造化されたスライドに変換する時間のかかる手作業をなくしつつ、その背後にあるリサーチの判断を置き換えることはありません。
AIがリサーチのワークフローで実際に時間を節約できる場所
最大の成果は、リサーチそのものではなく、リサーチ直後のステップで現れます。いくつかの点で、 AIスライド作成ツール プロセスを短縮します。
- 長いレポートを要約し、サブクエスチョンに関連する2、3のポイントにまとめること
- 生のインサイトからスライドの見出しを作成し、白紙のスライドを前に途方に暮れることがないようにすること
- 構築したい議論に基づいてスライドの構成を提案すること
- すでに検証済みのデータポイントからチャートやビジュアルを生成すること
- 密度の高い段落を言い換え、明確でプレゼンテーションに適した言葉にすること
このパターンは一貫しています。あなたが判断と検証済みの情報源を提供します。AIは、通常最も時間のかかる書式設定、下書き作成、レイアウト作業を処理します。
Presentations.AIがリサーチからスライドへの引き渡しにどのように適合するか
メモがサブクエスチョンごとに整理されたら、 AIプレゼンテーション作成ツール Presentations.AIのものは、そのアウトラインを数分でデザインされた資料に変換できます。構造化されたメモや概要を貼り付けると、ツールが、見出し、レイアウト、ビジュアルがすでに配置された完全なスライドセットを作成します。
そこから、あなたの仕事は作成から編集へと移行します。検証済みの統計データを入れ替え、あなたの声に合うように言葉を調整し、すべての引用元が正しいことを確認します。レイアウトのデザインやテキストとビジュアルのバランス調整といった時間のかかる部分は、すでに完了しています。
プロのヒント: AIが生成したスライドは、最終版ではなく、あくまでも下書きとして扱ってください。プレゼンテーションの信頼性を高めるのは、あなたのリサーチと判断力です。ツールは、編集段階への移行を大幅にスピードアップさせるだけです。
AIが関わるものすべてに、人間によるレビューのステップを設けてください
AIは微妙なニュアンスを見落としたり、統計を誤解したり、主張を過度に単純化したりすることがあります。AIが作成したスライドを最終版に含める前に、以下の点を素早く確認してください。
- 見出しは、参照元が実際に述べている内容と一致していますか?
- 数字、日付、名前は正しいですか?
- 引用は、正しい主張に紐付けられていますか?
- トーンは、他のスライドや聴衆に合っていますか?
この最終確認は数分で終わり、あなたのリサーチが築き上げてきたすべてを守ります。
リサーチを基盤にする
実際に成功するプレゼンテーションの裏には、常にリサーチという静かな原動力があります。鋭い問いから始め、信頼できる情報源から情報を集め、保存する情報を精査し、論点ごとにメモを整理すれば、スライド作成段階は当てずっぽうではなくなります。すでに構成があり、証拠があり、どのアイデアがスライドに載せる価値があるか、すでに分かっているはずです。
目標は、適切な情報を集め、それを基準に照らし合わせ、聴衆が理解し信頼できるストーリーに変換することです。リサーチを準備段階ではなく、スライド作成の最初のステップとして捉えれば、最初のタブを開いた瞬間から、プロセス全体がより速く、落ち着いて、信頼性の高いものになります。