

기능
이 페이지에는 모든 기능이 설명되어 있습니다. 특정 기능에 대한 자세한 내용이 필요하시면 해당 섹션으로 이동하세요.
생성 및 제작

디자인 및 브랜딩
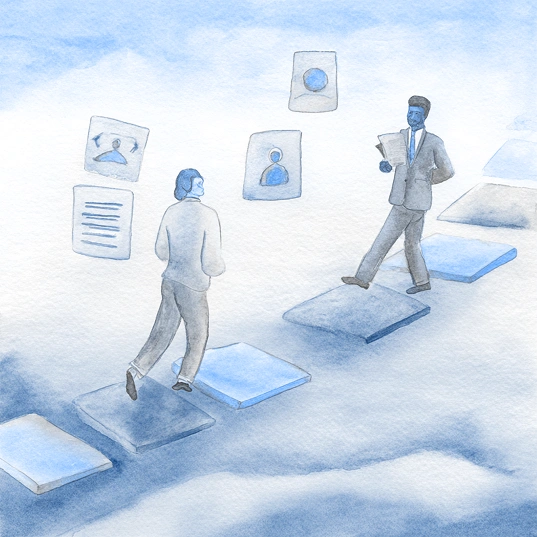
협업
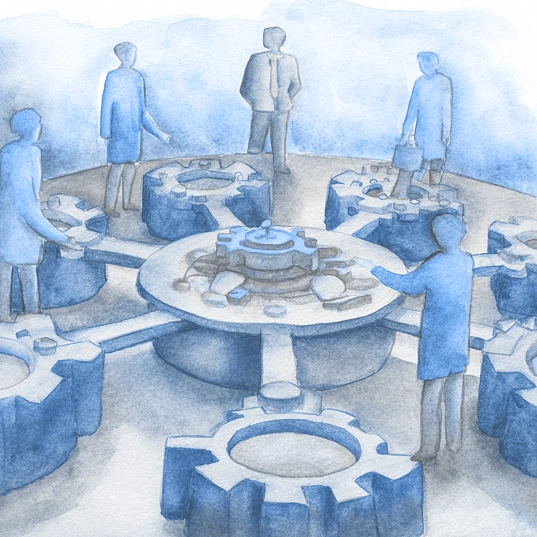
데이터 및 자동화
분석 및 인사이트

내보내기 및 호환성

엔터프라이즈 및 보안
통합

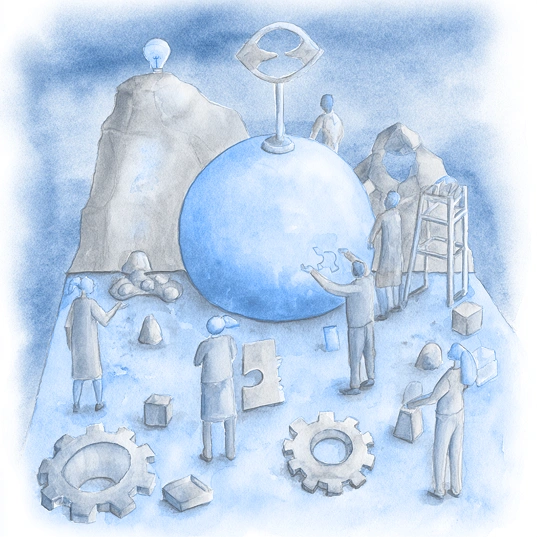
고급 기능


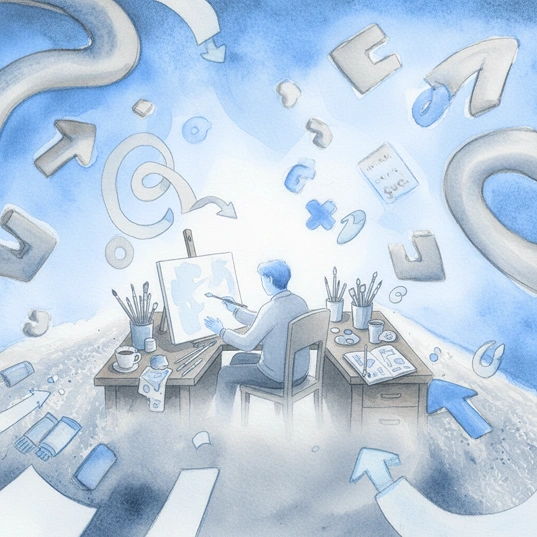
생성 및 제작
1. 대화형 생성

기능: 원하는 내용을 자연어로 입력하세요. AI가 내용을 구성하고, 작성하며, 디자인합니다.
사용 방법:
당신: "3분기 영업 프레젠테이션을 만들어줘. 매출은 15% 증가했지만, 파이프라인은 감소했어. 주요 성과는 엔터프라이즈 부문과 Acme Corp 파트너십이었어. 파이프라인 문제를 다뤄줘."
AI 생성:
- 제목 슬라이드
- 경영진 요약
- 차트가 포함된 매출 성장 슬라이드
- 분석이 포함된 파이프라인 우려 슬라이드
- 주요 성과 슬라이드
- 파이프라인 복구 계획
- 결론
제공되는 내용:
- 완벽한 프레젠테이션 구조
- 전문적인 슬라이드 디자인
- 적절한 시각화 자료
- 발표자 노트
절약된 시간: 프레젠테이션당 4-6시간
2. 문서 업로드 및 변환
What it does: Upload any document. AI reads, understands, and converts to presentation.
Supported formats:
- PDFs (whitepapers, reports, analyses)
- Word documents (.docx files)
- Text files and Google Docs
- Spreadsheets (data with context)
- Email threads (meeting summaries)
How it works:
- Upload document
- AI reads and extracts key points
- Structures into logical presentation flow
- Creates titles, bullets, speaker notes
- Identifies data for visualization
Example:
- Input: 25-page market research PDF
- Output: 12-slide presentation with findings, competitive landscape, recommendations
Time saved: 3-4 hours per document conversion
3. Remix / Transform Feature
What it does: Transform existing slides into new contexts or formats instantly.
Examples:
- "Make this sales deck into a customer-facing version" → Restructures for external audience
- "Turn this board presentation into an all-hands version" → Simplifies for employee audience
- "Create a mobile-friendly version" → Reformats for small screens
- "Condense this 50-slide deck into 15 must-know slides" → Extracts core points
How it works:
- Upload existing presentation
- Describe desired transformation
- AI remixes slides while preserving core data
- Design updates automatically
- Brand applies consistently
Time saved: 2-3 hours per transformation
4. AI Learning & Personalization
What it does: AI learns your preferences and style, applying them to new presentations.
How it works:
- You create presentation (sets your style baseline)
- AI observes: structure, messaging, visual preferences
- Next presentation: AI defaults to your style
- You refine: AI learns from your edits
- Over time: Output becomes increasingly personalized
Example:
- You create sales deck with "problem-solution" narrative
- Next sales deck: AI suggests that structure automatically
- You emphasize metrics and outcomes
- AI weights those in future generations
Result: Personalized, consistent presentation style without extra effort
Design & Branding
5. Anti-Fragile Design System
What it does: Slides adapt to your content without breaking design or requiring manual fixes.
The problem it solves: Traditional templates break when content changes:
- Add one more bullet → text gets cut off
- Add an image → layout breaks
- Add a chart → spacing collapses
- You spend 30 minutes fixing formatting
How Presentations.AI works:
- Slides have intelligent layout zones
- Content flows into zones automatically
- Design rules apply (spacing, alignment, hierarchy)
- Spacing adjusts intelligently
- Nothing breaks, nothing looks forced
Result: Professional layouts every time, no manual tweaking
6. Automatic Brand Extraction
What it does: Upload your website URL. AI extracts brand elements automatically.
What gets extracted:
- Primary, secondary, accent colors
- Typography (fonts, sizes, weights)
- Logo usage rules
- Imagery style (photography style, tone)
- Spacing and layout patterns
How it works:
- Input your website URL
- AI analyzes site design
- Extracts brand tokens (colors, fonts, logos)
- Creates brand profile
- Applies to all presentations automatically
Result: Consistent brand across all presentations without manual configuration
7. Centralized Brand Assets
What it does: Store all brand elements in one place. Apply to presentations instantly.
What you can store:
- Logos (multiple versions, formats)
- Color palette (primary, secondary, accents)
- Typography (fonts, sizes, weights, line heights)
- Brand images and patterns
- Approved illustrations
- Icon library
How it works:
- Upload assets once
- Apply to all presentations automatically
- Update centrally (cascades to all presentations)
- Control which teams can use which assets
Result: 100% brand consistency across all presentations
8. Style Variations
What it does: Switch between different visual approaches for same content.
Examples:
- Professional vs. Creative
- Minimal vs. Data-dense
- Corporate vs. Startup-friendly
- Dark mode vs. Light mode
- Animated vs. Static
How it works:
- Generate presentation
- Click "Change Style"
- Select variation
- Content reorganizes automatically
- Design updates instantly
Result: Multiple design options for same content in seconds
Collaboration
9. Real-Time Collaboration
What it does: Multiple people edit same presentation simultaneously.
How it works:
- Invite team members
- See edits in real-time
- No version conflicts
- Changes synced instantly
- All see the latest version
Like Google Docs, but for presentations.
10. Comments & Feedback
What it does: Leave feedback directly on slides. Have conversations about specific content.
Features:
- Thread discussions on any slide
- @mention specific people
- Resolve comments when addressed
- Comments persist with presentation history
Example:
- Comment on Slide 3: "Is this Q3 forecast locked or preliminary?"
- @Sarah replies: "Preliminary, could shift 10-15%"
- Designer updates slide with caveat
- Comment marked resolved
11. Approval Workflows
What it does: Route presentations through custom approval process.
Workflow options:
- Sequential: Person A → Person B → Person C
- Parallel: All approve simultaneously
- Conditional: Different paths based on content type
- Role-based: Any person with role X can approve
Example:
- Draft created
- Routes to Content Reviewer (approves messaging)
- Routes to Legal (ensures compliance)
- Routes to Executive (final sign-off)
- Only after all approvals: ready to share
12. Version History
What it does: Switch between different visual approaches for same content.
Examples:
- Professional vs. Creative
- Minimal vs. Data-dense
- Corporate vs. Startup-friendly
- Dark mode vs. Light mode
- Animated vs. Static
How it works:
- Generate presentation
- Click "Change Style"
- Select variation
- Content reorganizes automatically
- Design updates instantly
Result: Multiple design options for same content in seconds
13. Multiple Workspaces
What it does: Organize team into separate spaces with independent branding and settings.
Example:
- Sales workspace (sales presentations)
- Marketing workspace (campaign decks)
- Finance workspace (board decks)
- Each with own brand guidelines
Benefits:
- Separate brand standards per team
- Organized folder structure
- Access control at workspace level
- Billing per workspace
Data & Automation
14. Live Data Connections
What it does: Link presentations directly to data sources. Charts and tables stay current.
Supported sources:
Business Intelligence:
- Tableau, Power BI, Looker, Superset
Spreadsheets:
- Google Sheets, Microsoft Excel, Airtable
Databases:
- Snowflake, PostgreSQL, MySQL, MongoDB, Redshift
SaaS & CRM:
- Salesforce, HubSpot, Mixpanel, Databox, Google Analytics
How it works:
- Connect data source (authenticate once)
- Link chart/table to specific data
- Data pulls from source automatically
- Updates when data refreshes
Result: Charts and tables always show latest data
15. Presentation Refresh Agent
What it does: Automatically updates recurring presentations when data changes.
How it works:
- Set up presentation once
- Mark which sections auto-update
- Schedule refresh (daily, weekly, monthly)
- AI updates data, text, charts automatically
- Design and brand stay locked
Example:
- Monthly sales deck
- Linked to Salesforce pipeline
- Updates automatically 1st of month
- All charts and text refresh
- Brand colors/fonts stay locked
Time saved: 4-8 hours per month per presentation
16. Schedule-Based Updates
What it does: Automatically generate presentations on a schedule.
Examples:
- Monday morning: Weekly sales review
- 1st of month: Monthly performance report
- End of quarter: Board presentation
- Friday 5 PM: Weekly team update
How it works:
- Set up template
- Connect data sources
- Set schedule (Monday 8 AM, 1st of month, etc.)
- Presentation generates automatically
- Can go straight to stakeholders or require approval
Time saved: 2-4 hours per week/month
17. Change Validation
What it does: Checks every automated update for quality before finalizing.
Validates:
- Numbers make sense (no data errors)
- Layout stays intact (no broken formatting)
- Brand consistency (colors, fonts correct)
- Readability (text isn't cut off)
If validation fails:
- Presentation flagged for human review
- Old version stays live
- Team reviews new version manually
- Updates only after approval
Result: Automated updates that never break
Analytics & Insights
18. Engagement Metrics
What it does: See who viewed your presentation and when.
Metrics tracked:
- Who viewed (by person or role)
- When they viewed (date/time)
- Duration of view (how long they spent)
- Devices used (desktop, mobile, tablet)
Where it shows:
- Dashboard view in Presentations.AI
- Automatic email reports (daily, weekly, monthly)
Example: "Your board deck was viewed by 8 executives for an average of 18 minutes each on Tuesday morning."
19. Slide-Level Engagement
What it does: See which slides people spend most time on.
Metrics:
- Time spent on each slide
- Slides skipped
- Slide view order
- Drop-off points
Insights you get:
- "Slide 5 (Pricing) caused 40% drop-off"
- "Slide 3 (Problem Statement) kept 90% engaged"
- "Slides 12-15 were skipped by 60%"
Action you can take:
- Strengthen weak slides based on data
- Expand slides that resonate
- Restructure based on engagement patterns
20. Conversion Correlation
What it does: Connect presentation views to business outcomes.
Examples:
- "Sales presentations with more than 3 data visualizations have 35% higher close rate"
- "Investor pitches with Slide 7 (Team) have 2x meeting requests"
- "Client proposals under 15 slides have 40% faster response"
How it helps:
- Optimize for outcomes (not vanity metrics)
- Understand what converts
- A/B test different approaches
- Prove ROI of presentation improvements
21. Custom Reports
What it does: Build custom analytics reports on presentation performance.
Report types:
- By time period (weekly, monthly, quarterly)
- By presentation type (sales, board, investor)
- By audience segment (internal, external)
- By metric (engagement, conversion, time spent)
How you use it:
- Weekly leadership dashboard
- Monthly marketing performance review
- Quarterly board effectiveness report
- Investor relations tracking
Exports & Compatibility
22. Native PowerPoint Export
What it does: Download presentation as native .pptx file (fully editable).
What you get:
- Fully editable PowerPoint file
- All animations and transitions preserved
- Fonts and styling intact
- Embedded charts and images
- Speaker notes included
- Compatible with PowerPoint 2010+
Use cases:
- Share with people who prefer PowerPoint
- Further editing outside Presentations.AI
- Present from your laptop
- Archive for records
23. PDF Export
What it does: Export presentation as professional PDF.
Features:
- Beautiful PDF layout
- All fonts render correctly
- Images display at high quality
- Links preserved and clickable
- Optimized file size
- Print-ready
Use cases:
- Share professionally
- Preserve formatting (especially across devices)
- Print for events
- Archive for records
24. Batch Export
What it does: Export multiple presentations in multiple formats at once.
How it works:
- Select 10 presentations
- Choose formats (PPTX, PDF, images, HTML)
- Click export
- Get all files at once
Time saved: Export 10 presentations in 30 seconds vs 10 minutes manually
25. HTML Export
What it does: Export presentation as interactive HTML (embed-able).
Use cases:
- Embed in website or blog
- Share via link (no download needed)
- Interactive online presentation
- Mobile-friendly viewing
Enterprise & Security
26. Single Sign-On (SSO)
What it does: Use your company's identity provider to log in.
Supported providers:
- Okta
- Azure Active Directory (Microsoft)
- Google Workspace
- Ping Identity
- Other SAML 2.0 providers
Benefits:
- One password for all tools
- Automatic deactivation when employee leaves
- Password policies managed by IT
- Centralized identity management
27. Role-Based Access Control
What it does: Control exactly who can access what.
Role examples:
- Admin (manage all, change settings)
- Editor (create, edit, share)
- Viewer (view and comment)
- Commenter (view and comment, can't edit)
- Owner only (only the owner can edit)
Granularity:
- Set at organization level
- Set at workspace level
- Set per individual presentation
- Set per specific slide
Example: "Interns can view marketing deck, but can't edit. Finance team can view all presentations, but only manage finance presentations."
28. Audit Logging
What it does: Complete record of who did what, when.
Logged events:
- Login/logout
- File access
- Changes made (who, what, when)
- Sharing activities
- Permission changes
- Downloads
- Exports
Uses:
- Compliance audits
- Forensics ("who deleted that slide?")
- Security review
- Accountability
29. Data Encryption
What it does: Encrypt your data in transit and at rest.
In transit:
- TLS 1.2+ (same as banking)
- All communication encrypted
- No interception possible
At rest:
- AES-256 encryption
- Military-grade encryption
- Even if servers breached, data unreadable
Result: Your data is protected everywhere
30. Private Instances
What it does: Run Presentations.AI on isolated servers (completely separate from other customers).
Options:
- Air-gapped (no internet connection)
- Private cloud (your AWS/Azure account)
- On-premises (your data center)
Who needs this:
- Government agencies
- Defense contractors
- Financial institutions
- Heavily regulated industries
31. Data Residency Options
What it does: Choose where your data physically lives.
Options:
- US (Virginia)
- EU (Germany/Ireland)
- Custom region for enterprise
Why it matters:
- Compliance (GDPR, local laws)
- Performance (low latency)
- Privacy (data stays in region)
32. Compliance & Standards
Certifications & Readiness:
- SOC 2 Type II (independently audited)
- GDPR compliant
- HIPAA ready
- SOX ready
- ISO 27001 ready
What this means:
- Your data is protected by industry standards
- Independent verification of our security
- Meeting regulatory requirements
- Enterprise-ready infrastructure
Integrations
33. CRM Integrations
Connected CRMs:
- Salesforce
- HubSpot
- Pipedrive
- Intercom
What you can do:
- Generate proposals from deal data
- Auto-refresh sales decks with latest opportunity info
- Link presentations to deals for tracking
- Automated sales deck generation on trigger
34. BI Tool Integrations
Connected BI Platforms:
- Tableau
- Power BI
- Looker
- Superset
What you can do:
- Embed live BI dashboards
- Auto-refresh charts from queries
- BI 인사이트를 중심으로 프레젠테이션 구축
- 최신 분석으로 최신 정보 유지
35. 스프레드시트 통합
연결된 스프레드시트:
- 구글 시트
- 마이크로소프트 엑셀
- 에어테이블
- 노션
가능한 작업:
- 테이블을 스프레드시트 데이터에 연결
- 데이터 변경 시 자동 새로고침
- 스프레드시트 구조를 기반으로 프레젠테이션 생성
- 실시간 데이터 연결 유지
36. 커뮤니케이션 도구 통합
연결된 도구:
- 슬랙
- Microsoft Teams
- 이메일 알림
- 웹훅
가능한 작업:
- Slack/Teams에 프레젠테이션 공유
- 팀에 프레젠테이션 업데이트 알림
- 외부 이벤트로부터 프레젠테이션 트리거
- 커뮤니케이션 워크플로우에 통합
37. 웹훅 지원
기능: 외부 이벤트로부터 프레젠테이션 생성을 트리거합니다.
예시:
- 영업 담당자 거래 생성 → 프레젠테이션 자동 생성
- 월별 데이터 새로고침 완료 → 이사회 덱 업데이트
- 고객 계약 체결 → 제안서 프레젠테이션 생성
- 캠페인 시작 → 캠페인 덱 생성
고급 기능
38. 템플릿 빌더
기능: 사용자 지정 프레젠테이션 템플릿을 만듭니다.
사용자 지정 가능 항목:
- 슬라이드 레이아웃
- 색상 구성표
- 타이포그래피
- 로고 배치
- 승인된 이미지
장점:
- 모든 프레젠테이션에서 일관된 모양
- 팀은 가이드라인을 자동으로 따릅니다
- 강제 적용 가능 (팀은 템플릿을 변경할 수 없습니다)
- 한 번 업데이트하면 모든 곳에 적용됩니다
39. 마스터 슬라이드 관리
기능: 프레젠테이션 구조를 한 번 정의하면 모든 곳에 적용됩니다.
설정하는 내용:
- 기본 레이아웃
- 글꼴 선택
- 색상 팔레트
- 간격 규칙
- 에셋 배치
장점: 모든 프레젠테이션이 설정을 상속하며, 필요한 경우 전역적으로 편집할 수 있습니다.
40. AI 글쓰기 도우미
작동 방식: AI로 슬라이드 내용 생성 및 다듬기.
기능:
- 개요에서 생성
- 기존 텍스트 다듬기
- 어조 조정 (전문적, 비격식적, 기술적)
- 내용 축소/확장
- 명확성 향상
예시: 입력: "저희 제품은 여러 면에서 좋습니다." AI 개선: "Presentations.AI는 프레젠테이션 제작 시간을 80% 단축하여 팀이 서식 지정 대신 전략에 집중할 수 있도록 합니다."